Editorial responsibility for this article rests with Wuhan Ooi Photoelectric Technology Co., Ltd. Written and reviewed by the Ooitech editorial team. See our editorial policy for how we write, where AI tools are used, and how to request a correction.
AlOx Thickness and TOPCon UVID: From 3.24% to 0.85%
Table of Contents
Quick answer: On a TOPCon module the ultraviolet loss is set by the front stack rather than by the cell name. In the work collected in a 2026 review, moving the front AlOx from 2.8 nm to 4.1 nm cut the relative maximum power loss after 60 kWh/m² of UV from 3.24% to 0.85%. Pairing an AlOx change with a SiNx refractive index change cut the loss after 30 kWh/m² from 2.54% to 1.16%. Across industrial samples in the same review, implied voltage loss at the maximum power point ranged from under 3 mV to over 38 mV, and the most sensitive group reached about 7% relative efficiency loss. Those runs used different samples, doses and measurement histories, so they point to a direction rather than a specification. The figure that can travel between supplier and buyer is the one taken after a defined recovery step.
Two TOPCon lines can build the same cell design and report ultraviolet losses a factor of four apart. The gap usually sits in a stack less than 100 nm thick, and in when the measurement was taken.
Where the ultraviolet stops
Ultraviolet light between 280 and 400 nm carries 3.1 to 4.4 eV per photon. Silicon needs 1.12 eV to free a carrier, so most of that energy becomes heat within a few tens of nanometres of the surface. In a TOPCon cell that shallow region holds the boron emitter, the aluminum oxide layer that passivates it, the silicon nitride that doubles as the anti-reflection coating, and optionally an oxynitride cap.
That is why UV damage is a stack problem rather than a bulk problem. The energy is deposited exactly where the bonds and the fixed charge that hold surface recombination down are located, and a change of one nanometre in one of those films moves the outcome.
It also splits the loss in two. Part of what UV takes away comes back under light or mild heat, and part does not. The classification that separates the reversible share from the residual share is set out in the UVID split between reversible and irreversible loss, and everything below assumes that step has been applied. For the chemical side, the ToF-SIMS and XPS evidence that the oxide itself changes bonding state under UV is in the chemical evolution study.
The published spread: under 3 mV to over 38 mV
The review puts industrial accelerated results side by side, and the spread is wide. Implied voltage loss at the maximum power point runs from below 3 mV in the least sensitive samples to above 38 mV in the worst, with the most sensitive group losing roughly 7% of relative efficiency.
That range describes the front stack recipe, the deposition method and the process history, not the cell architecture. Two suppliers can run the same design and land at opposite ends of it, which is why a single published figure is a poor specification and a useful warning.
Benchmark inside your own process window. Treat a number from another company's sample as evidence about which end of the range is reachable, not about where your line sits.
The review is also explicit about the record that has to travel with the number: initial state, dose and spectrum, dark storage after exposure, recovery treatment, and the time of measurement. Leave any of those out and the figure cannot be compared with anything, including your own earlier run.
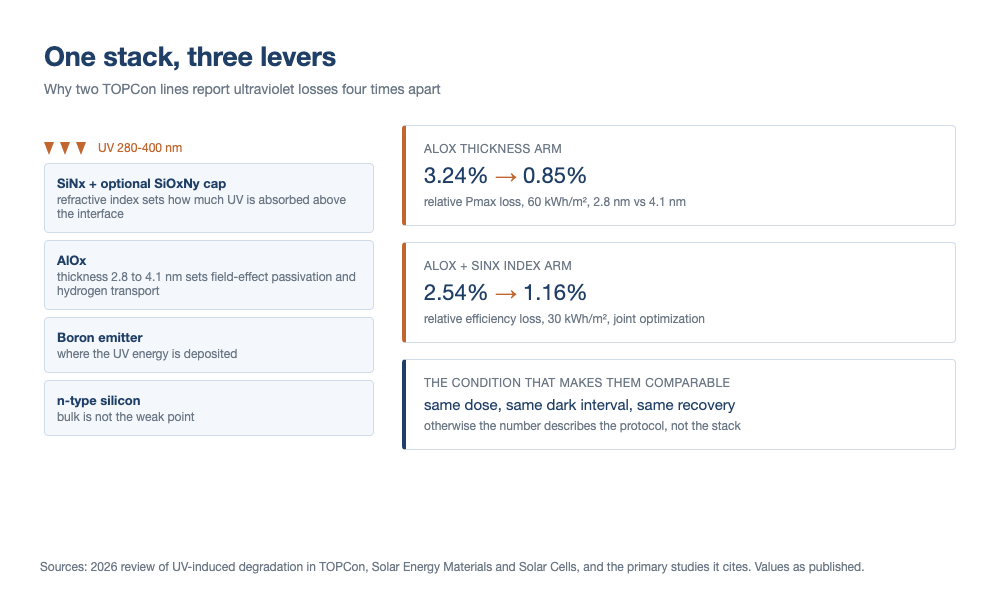
AlOx thickness: 2.8 nm to 4.1 nm, 3.24% to 0.85%
The most quoted result in the review is a thickness comparison on modules. Raising the front AlOx from 2.8 nm to 4.1 nm cut the relative maximum power loss after 60 kWh/m² of UV from 3.24% to 0.85%. After natural light exposure and other recovery treatments, power, Voc, FF and Jsc all moved back up, by different amounts.
Read the recovery clause carefully. The two loss figures are post-exposure numbers, and the same study then applied recovery. The comparison is still a comparison of stack sensitivity, but the absolute values belong to the protocol rather than to the product.
Why a thicker film helps
Aluminum oxide does two jobs at once. It passivates the interface chemically, and it holds a fixed negative charge that repels electrons from the surface. Thickness changes both, and it also changes how hydrogen moves through the stack during firing and under illumination. The review names those three pathways as the route through which a thickness change alters UV sensitivity.
Where the gain stops
Thicker is not automatically better. Past an optimum the film can blister, add interface defects of its own, and raise the tunneling resistance the contact has to live with. Alumina from ALD and alumina from PECVD do not respond in the same way, so a thickness that works on one tool may not transfer to another.
The optimization also does not close on the oxide alone. It has to be run with the nitride cap, the starting passivation and the firing profile inside the same design, because the hydrogen budget is shared across all of them.
SiNx index: absorb the light above the interface
The second lever sits on top of the first. Raise the short-wavelength absorption of the silicon nitride and less ultraviolet reaches the interface below it. The cost is optical: a film tuned to absorb also gives up some anti-reflection performance and adds parasitic absorption, and module current pays for it. The index-to-power trade-off is worked through in the SiNx front-film comparison.
The joint run that reported 1.16%
One set of samples in the review combined an oxide thickness change with a nitride refractive index change. After 30 kWh/m² the relative efficiency loss fell from 2.54% to 1.16%. The authors are careful about scope: one structure at one dose, not a figure to scale onto another line.
That caution matters, because two published directions look contradictory at first. One route raises the index so the coating absorbs more UV before it reaches the interface. Another pairs a thicker oxide with a nitride of lower Si:N ratio and gains partly through reflection at that layer. Both can be right. The index cannot be chosen for optics alone, and a value that helps one stack can hurt the next one.
Three levers on the same front stack. The numbers on the right are published values at the stated doses, not a specification.
The dose ladder: 15, 30, 60 and 120 kWh/m²
Dose decides what a test is able to see, and the numbers in circulation are not interchangeable.
| Dose | Where it appears | What it can show | What it hides |
|---|---|---|---|
| 15 kWh/m² | UV preconditioning in IEC 61215, the MQT 10 step | Early failures of encapsulant, backsheet and other polymers | Cell-level stack sensitivity: the dose is low and no recovery step is specified |
| 30 kWh/m² | The joint oxide and nitride index run in the review | Whether a stack change moves the loss at all, and roughly by how much | Absolute loss, since one structure at one dose says nothing about another |
| 60 kWh/m² | The oxide thickness comparison; the chemical evolution work | Thickness effects and bonding changes at the front stack | The residual share, unless a recovery step follows the exposure |
| 120 kWh/m² | Cell-level UVID programmes at service-relevant doses | Whether persistent damage appears at all at service-relevant doses | Anything about a specific production stack, because the samples differ |
The ladder explains a familiar confusion. A module can pass the 15 kWh/m² preconditioning step and still carry a stack that would lose several percent at 60. That test was written to catch polymer failures, and it does that job well. It was not written to rank front stacks.
When preparing modules for the 15 kWh/m² polymer screening, we run uniform thermal cycles across both chambers to prevent uneven cross-linking from distorting subsequent degradation data.
It also explains why published losses are not comparable in the way they look. A 0.85% loss at 60 kWh/m² and a 1.16% loss at 30 kWh/m² do not order those two stacks. The doses differ, the samples differ, and the recovery steps differ.
Measure Voc first, then FF, and stop reading Jsc
Across the module work collected in the review, Voc is usually the parameter that falls most in dark storage. FF can fall as well. Jsc changes comparatively little.
The order has a physical reason. The damage sits in surface passivation, and surface recombination hits voltage hardest. A report built on Jsc therefore understates the effect, and one built on FF mixes passivation loss with contact resistance.
A non-contact measurement carries the same information earlier, through the implied voltage curve, and it separates passivation from series resistance instead of blending them. The non-contact IV write-up shows how far that curve tracks passivation degradation.
Dark storage is part of the test, not a waiting period
The mechanism proposed in the review is charge rather than chemistry alone. During exposure, some photogenerated electrons are captured in traps inside the oxide. That changes the fixed charge and weakens field-effect passivation while the light is on. Move the sample into the dark and the trapped charge is released, so interface recombination that was partly masked becomes visible. Power falls after the lamp is off.
How far and how fast depends on temperature, on whether the sample had UV pre-aging, and on the starting film and cell structure. It is not a function of elapsed time alone, which is why two labs can report different dark-storage kinetics on the same product.
There is a measurement trap inside this. If the sample sees light on its way from the dark cabinet to the flash tester, the act of measuring changes the state being measured. The interval between storage and measurement has to be fixed and recorded, or repeatability disappears.
Recovery works in the other direction. Short illumination or a mild anneal returns part of the loss, and repeated flashes can push module power back up. One study in the review found that room-temperature current injection did not produce the same recovery under its conditions. Spectrum, dose, temperature and bias all change the outcome, so the treatments are not interchangeable.
A stack DOE that answers a production question
The published figures give directions. A line needs its own answer, and it can get one with a small, fixed design.
One film per arm, one dose per arm
| Arm | What changes | What it tests |
|---|---|---|
| A | Baseline stack | The reference every other arm is measured against |
| B | AlOx +0.5 nm | Whether a small thickness step is visible above run-to-run noise |
| C | AlOx +1.3 nm | Upper end of the published 2.8 to 4.1 nm window |
| D | SiNx index step | Optical UV gain against the current it costs |
| E | Oxynitride cap added, same oxide | Cap contribution isolated from the thickness change |
Hold four things constant across all arms: dose, chamber temperature, the dark interval before measurement, and the recovery treatment. Measure each arm as-exposed and again after recovery, and report both. Three or four modules per arm is enough to see a difference of the size reported in the review; one module per arm is not.
When processing batches of three or four modules per test arm, we maintain identical platen temperatures across each chamber run so that encapsulation conditions do not add scatter to the electrical measurements.
Screen at the lower dose and confirm the winner at the higher one. That costs an extra UV run on one arm instead of on every arm, and it keeps the expensive characterization where it earns something.
Change one film at a time. The review's own result shows that thickness and index interact, but an arm that moves both cannot tell you which one produced the gain, and the next process change becomes a guess.
Two process notes. A firing profile change is a UV change, because the hydrogen budget moves with it, so any retest rule has to cover it. A supplier change on the oxide, the nitride or the precursor reopens the same question for the same reason.
What the field data changes
The review also collects outdoor evidence. In one field comparison, modules that had been through dark storage recovered power once they were re-illuminated, and the recoverable part of the dark-storage loss did not appear as an equal gap in energy generation. A laboratory number taken straight after exposure cannot be converted into an outdoor yield loss.
That does not make the effect ignorable. Outdoor spectrum, day and night temperature, encapsulant and storage history all differ from the chamber, and the coupling between UV, damp heat and bias is not mapped yet. The damp heat failure-mode write-up covers the part of that coupling that is already documented.
The residual, non-recovering share is the one that belongs in a warranty discussion, and the review is direct about its status: the defect mechanism and the mitigation aimed at it specifically are still thin. Module-level levers exist in the meantime. Films that cut off or down-shift UV before it reaches the cells lower the dose at the surface, and their specification is covered in the UV light-conversion film article. They do not repair a weak stack, and they are best judged after the split between recovered and residual loss is known.
Where these numbers come from
Every figure here is taken from a review published in Solar Energy Materials and Solar Cells in October 2026 by a Trina Solar team on UV-induced degradation in TOPCon cells, together with the primary studies it cites: the aluminum oxide thickness work, the ToF-SIMS hydrogen study, the field comparison, and the stabilization procedure work.
The values are reported as published. The samples behind them are different cells, different modules, different doses and different measurement histories, and none of it comes from one controlled experiment. Keep the conditions attached to each number, and treat the direction of each effect as the part that transfers.
FAQ
Q: Does a thicker AlOx layer always reduce UV loss?
No. The published gain from 2.8 nm to 4.1 nm does not continue indefinitely. Past the optimum an oxide film can blister, add interface defects and raise contact resistance, and ALD and PECVD films respond differently. Treat thickness as one arm in a design, not as a dial that only improves things in one direction.
Q: Why is 60 kWh/m² used instead of the 15 kWh/m² in IEC 61215?
Because the two tests answer different questions. The preconditioning step was written to expose early failures of encapsulant, backsheet and other polymers, so the dose is modest and no recovery step is specified. A stack comparison needs a dose large enough for persistent damage to appear, then a recovery step to strip out the metastable share.
Q: Which parameter should be tracked first?
Voc, then FF, then Jsc. The damage is in surface passivation, so voltage responds first and hardest. A report that leads with Jsc understates the effect, and one that leads with FF blends passivation loss into contact resistance.
Q: Can dark storage be skipped to save time?
Only if you accept a number that depends on the interval you happened to use. The loss keeps growing in the dark and the trapped charge releases over time. Skipping the step does not remove the effect from the product, it removes the information from the report.
Q: Does raising the SiNx refractive index cost module power?
Usually some. A nitride tuned to absorb short wavelengths gives up part of its anti-reflection performance and adds parasitic absorption, and the current loss is real. The design question is whether the UV gain is worth that current, which is why the index belongs in a joint run with the oxide rather than in isolation.
Q: Do these numbers transfer to HJT or BC cells?
Only partly. The mechanism depends on the front passivation stack, and those architectures do not use the same film sequence. What transfers is the discipline: fix the dose, fix the dark interval, apply a defined recovery, report the residual. The nanometre values do not.
Q: How do I compare two suppliers' UV reports?
Ask three questions. Was the sample stabilized before the reported measurement, how long did it sit in the dark between exposure and measurement, and what was the loss after recovery as distinct from the loss straight after exposure. If any answer is missing, the number is not comparable, including with that supplier's own earlier report.
Q: Is the recovered part of the loss harmless?
Harmless to a warranty model, not harmless to a test report. The recovered share does not belong in a 25-year energy forecast, which is why the split exists. Whether repeated cycles slowly convert recovered loss into residual loss is open, and answering it needs cycling data rather than one run.
Final Thoughts
Ultraviolet sensitivity is a property of a four-layer stack, and the published numbers show how much one nanometre of oxide can move it. Before the next process change, fix the dose, the dark interval and the recovery step, then run five arms instead of one. The result will not match any figure in this article, and that is the point: it will describe your stack instead.
OOITech builds single and double chamber solar panel laminator machines with electric or oil heating to maintain stable thermal profiles during encapsulation. If you are optimizing cell stacks or testing packaging materials against ultraviolet degradation, send your module stack specifications, assembly drawings, or test samples to our engineering team for technical evaluation.