TOPCon UVID: Reversible and Irreversible UV Degradation
Table of Contents
Quick answer: Ultraviolet-induced degradation in TOPCon cells is not a single number. Part of the power lost under UV returns when the cell is exposed to light again, and part does not. A standardized light soak draws the line: what comes back is r-UVID, what is still missing afterwards is ir-UVID. Only the second part belongs in a warranty or an energy-yield model, and only the second part is what a UV test should be pricing.
A UV test on a TOPCon module is easy to run and surprisingly easy to misread. Take a batch of cells, expose them to ultraviolet light, measure the power, and write down the loss. Do the same measurement a day later and the number will be worse. Leave the samples in the dark for two weeks and it gets worse again. Expose them to ordinary light for a while, and most of that extra loss disappears.
None of that behavior is a measurement error. It is the material doing what it does. The problem is that a report without a recovery step cannot tell you whether the module lost two points of power forever or lost three points of which two will come back the next sunny morning. Those two readings lead to very different warranty provisions.
A classification published in 2026 in Solar Energy Materials and Solar Cells, together with the recovery procedure being written into IEC TS 63624-1, gives the industry a way to separate the two. This article covers where the damage happens, why the measurement drifts, how the split is calculated, and what it changes for a production line.
Where the ultraviolet goes, and why the front side takes the hit
Ultraviolet light between 280 and 400 nanometres carries photon energies of roughly 3.1 to 4.4 electron volts. Silicon needs 1.12 eV to generate an electron-hole pair, so a UV photon deposits far more energy than the cell can convert. The excess goes into heat within a very short distance, and that distance is measured in tens of nanometres.
In a TOPCon cell, that shallow region is not empty space. It contains the boron-doped p+ emitter, plus the stack that makes the emitter usable: aluminium oxide for chemical and field-effect passivation, silicon nitride that doubles as the anti-reflection coating, and optionally a silicon oxynitride cap between them. Hydrogen is present throughout, introduced during deposition and moved around by the firing step.
This is why ultraviolet is more than a surface heating problem. The energy is absorbed exactly where the silicon-hydrogen bonds and the fixed charge that keep surface recombination low are located. Absorb enough of it and those bonds are disturbed, the interface charge shifts, surface recombination rises, and the open-circuit voltage falls. The damage mechanism sits in the passivation, not in the bulk.
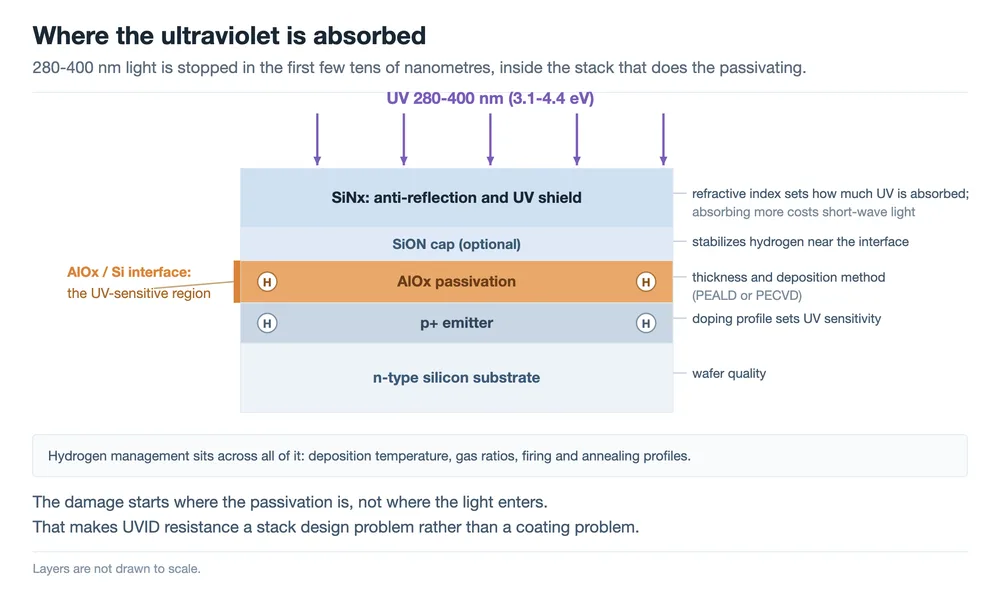
The short absorption depth also explains why UVID is not a bulk lifetime problem that shows up years later. It is a near-surface effect that responds to what the front-side deposition processes produce, which is why two manufacturers running the same cell architecture can measure visibly different UV sensitivity.
Why the reading keeps moving: metastability
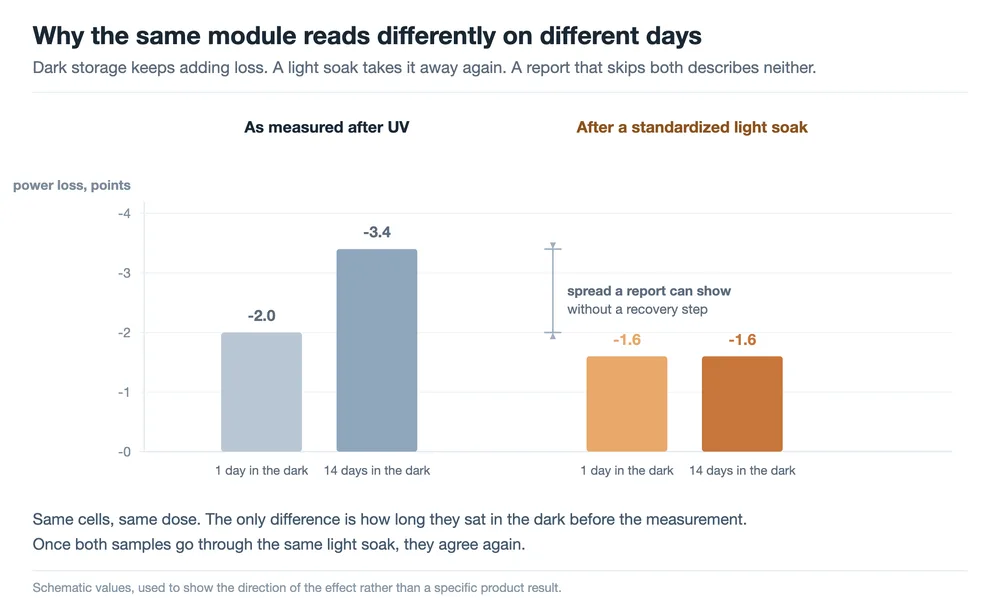
The first surprise in a TOPCon UV test is that switching off the lamp does not stop the degradation. Samples left in the dark after UV exposure continue to lose power, mostly as further Voc decline. The reported kinetics follow a double-exponential form: a fast component early on, a slower one that keeps working for days.
The second surprise is that most of this additional loss is not permanent. Light soaking or a thermal anneal recovers it. The current explanation points to hydrogen redistribution in the passivation stack and to changes in the charge trap states at the passivated interface, both of which are reversible under the right conditions. The state is metastable rather than stable, and the measurement follows the state.
As reported, two processes sit behind that behaviour. Ultraviolet photons carry enough energy to break silicon–hydrogen bonds near the passivation layer, and the hydrogen they release becomes mobile. Where it comes to rest decides how much extra recombination the cell sees, and hydrogen accumulating at the interface in a recombination-active configuration is the state the recovery step undoes. Separately, the aluminium oxide layer temporarily holds negative charge after exposure, which shifts the field at the interface and weakens passivation while it lasts. Neither is a permanent change to the stack. A light soak or a mild anneal gives the hydrogen a chance to redistribute and lets the trapped charge dissipate, which is why the recovery step returns power rather than merely hiding the number.
The practical consequence is uncomfortable for anyone comparing datasheets. The same batch measured one day after UV and two weeks after UV can differ enough to change a pass-fail decision, and neither reading is wrong. It is also a condition that does not exist outdoors. Modules in the field are re-illuminated every morning, which keeps reversing the metastable part instead of letting it accumulate.
Outdoor work points the same way. A 2026 study published in EPJ Photovoltaics compared four module types across five outdoor sites over periods up to 28 months. It concluded that a short light-soak stabilization after UV is necessary for laboratory evaluation, and that the step cancels the dark-storage effect. With stabilization applied, the indoor result correlates well with outdoor degradation, with only a slight overestimate for TOPCon modules.
A separate study published in Energy & Environmental Science used a UV Raman platform to look at the same question from the material side and confirmed that the reversible part of TOPCon UVID recovers under light soaking. The mechanism is still being refined, but the direction is no longer in dispute.
r-UVID and ir-UVID: one light soak draws the line
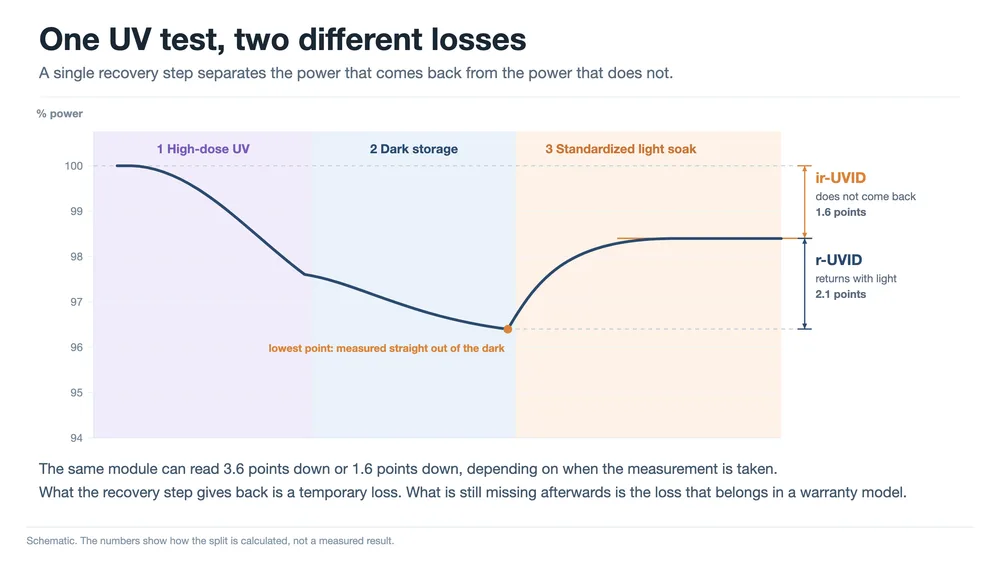
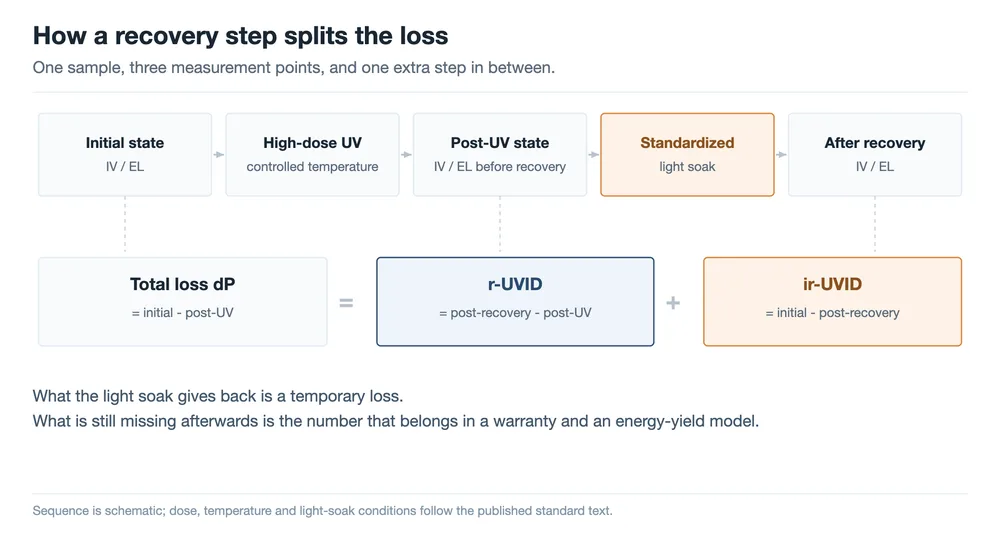
Once metastability is on the table, the classification almost writes itself. Insert one standardized light soak (or an equivalent anneal) between the post-UV measurement and the final measurement. Whatever the soak brings back is the reversible part of ultraviolet-induced degradation, r-UVID. Whatever is still missing after the soak is the irreversible part, ir-UVID.
The arithmetic is simple enough to put on a test report:
- Total loss (initial minus post-UV) is what the UV exposure produced, metastable part included.
- r-UVID equals the post-recovery measurement minus the post-UV measurement, expressed as the gain the soak returned.
- ir-UVID equals the initial measurement minus the post-recovery measurement, and it is the only figure that should be carried into a warranty model or a yield forecast.
| Dimension | r-UVID (reversible) | ir-UVID (irreversible) |
|---|---|---|
| How it is defined | Recovered by a standardized light soak or anneal | Still present after the recovery step |
| How it shows up | Voc keeps falling in the dark, following double-exponential kinetics | Power and Voc loss that survive the recovery procedure |
| Mechanism, as reported | Hydrogen redistribution and changes in interface charge trap states | Persistent change in the passivation stack that does not self-heal; under study |
| Effect in the field | Reversed daily by sunlight; no yield effect reported in field data | Counts directly in long-term degradation and energy yield |
| Who needs it | Test laboratories and certification bodies | Warranty, financing and asset evaluation |
The value of the split is not academic. A loss that disappears in the first hour of daylight and a loss that stays for twenty-five years have nothing in common except the number they produced on the day of the test. Separating them lets a laboratory report be quoted directly in a warranty discussion instead of being discounted as pessimistic.
Why the standard asks for a higher dose
The UV test most modules already pass is the UV preconditioning step in IEC 61215, known as MQT 10. It applies a cumulative dose of 15 kWh/m². That test was designed to expose early failures of encapsulants, backsheets and other polymer materials, and for that purpose it works.
It was not designed for cell-level UVID, and in two respects it is not suited to it. The dose is low compared with the ultraviolet a module receives in service, and the procedure specifies no recovery step, so the metastable part is never separated from the permanent part. A cell-level mechanism that needs a larger dose before it becomes visible can pass MQT 10 without ever being seen.
The dose discussed in the current work is 120 kWh/m², roughly five to eight years of outdoor ultraviolet exposure depending on location and mounting. The logic is sequential: apply enough UV that persistent damage has a chance to appear, then apply the light soak to strip out the metastable contribution, and compare what is left. Without the larger dose the second step has nothing to work on.
Where IEC TS 63624-1 stands
The classification matters partly because it lines up with a document already moving through the IEC system: IEC TS 63624-1, Photovoltaic (PV) modules – Test method for ultraviolet-induced degradation – Part 1: Crystalline silicon. It is a Technical Specification under IEC TC 82, the committee responsible for photovoltaic system standards.
Its scope covers the light source, test conditions, irradiation dose and sample requirements, together with the stabilization and recovery procedures for the metastable part. That last item is the one that turns a UV exposure test into something whose result can be compared between laboratories. The project reached the 50.00 stage, meaning the final text was submitted for approval, on 17 June 2026, and had not been published when this article was written. Until it is, the dose and soak conditions quoted in papers and test programmes remain draft values.
Testing practice has already moved ahead of the document. A large module test programme runs the UV exposure at 60 °C with the sample held at short circuit, applying 120 kWh/m² to the front surface from a metal-halide source. If the average degradation reaches 2 percent or more, the procedure adds at least 1 kWh/m² of full-spectrum light soaking and repeats the measurement within four hours, with an extended variant available for longer exposure. Other laboratories now advertise UV testing aligned with the draft specification.
Read the two documents as separate jobs. The standard decides how the test is run. The r-UVID and ir-UVID classification decides how the result is interpreted. A test report that follows the standard but reports a single number throws away the distinction the standard was written to enable.
Mitigation: a stack design problem, not a coating problem
How severe UVID turns out to be depends on the thickness and deposition method of the aluminium oxide layer, on the hydrogen content and bonding configuration in the stack, and on the choice of cap layer. Every lever available has a cost attached, which is why the reported results vary so much between manufacturers running nominally similar processes.
| Lever | Benefit | Cost or risk |
|---|---|---|
| Thicker or re-optimized AlOx | The most direct gain in UV resistance | Blisters at excessive thickness, more interface defects, higher tunnelling resistance |
| SiON cap layer | Stabilizes hydrogen near the interface and reduces charge interference | Process window and line compatibility still being validated |
| PEALD instead of conventional PECVD | Generally better UV resistance | Result depends on the specific process; additional equipment and takt cost |
| Higher SiNx refractive index | More UV absorbed in the coating instead of at the interface below it | Absorbing more costs short-wavelength optical gain |
| Hydrogen management | Keeps the beneficial hydrogen passivation in place | Has to be coordinated with deposition temperature, gas ratios, firing and annealing profiles |
The silicon nitride layer deserves a note of its own, because two published routes point in directions that look contradictory. One raises the refractive index so the coating absorbs more ultraviolet before it reaches the interface. The other pairs a thicker AlOx layer with a SiNx layer of lower Si:N ratio and reports better UV resistance, partly through increased reflection at that layer. The two are not in conflict, but they do show that the index cannot be chosen for optics alone. It has to be set within the optical and passivation design of the whole stack, and the value that helps one stack can hurt another.
At module level there is a second and independent lever: encapsulant films that cut off ultraviolet or shift it to longer wavelengths before it reaches the cells. That approach reduces the UV dose arriving at the cell surface, which limits both parts of the loss. It does not repair a weak passivation stack, and it is best evaluated after the r-UVID and ir-UVID split is known, so that the film's contribution can be separated from what the cell would have recovered anyway. See UV light-conversion film for how those films are specified and what their key quality parameters are.
What this changes on a production line
For most cell and module factories, the operational change is smaller than the conceptual one, but it is not zero. Four things are worth putting in place now.
Record the stabilization protocol with every power measurement
As-measured and post-recovery power are different quantities. A report that lists only one of them cannot be compared with a report that lists the other, and the difference is larger than most process variation. Dose, chamber temperature, waiting time in the dark before measurement, and whether a light soak was applied all need to travel with the number.
Plan for two measurement points, not one
Splitting the loss requires a post-UV measurement, a soak step, and a second measurement. On an existing line that usually means either routing samples through the IV tester twice with a documented soak between passes, or splitting each batch into an as-measured set and a stabilized set and reporting both. EL images belong in both passes, since the interest is in what recovers at the junction and not just in the numbers.
Treat UV sensitivity as a process output, not a cell-architecture property
AlOx deposition method, SiNx deposition conditions and index, the hydrogen budget of the stack, and the firing and annealing profiles all move UV sensitivity. That means a change in the firing profile is a change in UV response even when nothing else on the line has moved. It also means a supplier change on any of those processes reopens the question, which is the same logic that drives retest rules for material and design changes under IEC TS 62915.
Ask three questions of any incoming UV report
Was the sample stabilized before the reported measurement. How long did it sit in the dark between exposure and measurement. And what is the loss after recovery, as distinct from the loss straight after UV. If the answers are not available, the number is not comparable with anything, including the vendor's own previous report. An example makes the arithmetic concrete. A report shows a 3% decline after UV exposure and nothing further. If a standardized soak had been run and returned 2 points of that, then 2 points are r-UVID, a figure with no bearing on a 25-year energy forecast, and 1 point is ir-UVID, which does have one. The same 3% can mean either thing depending on which measurement the laboratory chose to put on the page, and that ambiguity is the reason the split exists. Facilities that already run IEC certification test equipment have the hardware for the exposure part; the stabilization sequence and the record-keeping are what usually need adding.
What is still open
The r-UVID and ir-UVID split answers a measurement question. Several questions around it are still open, and it is worth being explicit about them.
- Reversible is not the same as harmless. A 2026 study reported that part of the degradation is electrically reversible while the underlying structure is not. Whether repeated UV-and-recovery cycles gradually convert r-UVID into ir-UVID is exactly the kind of question that needs several years of cycling data rather than one test.
- Thermal and ultraviolet effects are coupled. Module temperature during UV exposure changes the outcome, and separating the two contributions is not yet routine.
- Light source equivalence is unresolved. Fluorescent and metal-halide sources do not match in spectrum, and a criterion for equivalence between them has not been settled. The same applies to the relative weight of UVB and UVA within the 280–400 nm band.
- Parameters do not degrade together. Voc responds first and most clearly; how the short-circuit current and other passivation-related parameters behave over the same exposure is still being characterised.
- Mitigation for ir-UVID is immature. Most of the published levers reduce the metastable part or the total dose. Options that specifically address the persistent component are still being developed.
FAQ
What does UVID stand for?
Ultraviolet-induced degradation: power loss caused by ultraviolet exposure. In TOPCon cells the effect starts at the front surface, where ultraviolet is absorbed in the emitter and the passivation stack.
What is the difference between r-UVID and ir-UVID?
r-UVID is the share of the loss that a standardized light soak or anneal returns. ir-UVID is what is still missing after that recovery step. Only ir-UVID should be carried into a warranty provision or an energy-yield model.
Why does the same module read differently on different days after UV?
Because the loss keeps growing while the sample sits in the dark. That additional loss is metastable and largely recovers under light. A test protocol without a stabilization step therefore reports a number that depends on the waiting time rather than on the module.
Is UVID a TOPCon-only problem?
No. Other cell technologies lose power under ultraviolet too. TOPCon is a focus of current work because its front-side AlOx and SiNx passivation makes it sensitive to near-surface absorption. The spread between manufacturers is also wide enough that the effect has become a qualification question rather than a footnote.
How much UV does IEC 61215 apply?
The UV preconditioning step, MQT 10, applies a cumulative 15 kWh/m². That dose targets early failures of polymeric materials. Cell-level UVID work discusses 120 kWh/m², roughly five to eight years of outdoor ultraviolet exposure, followed by a standardized recovery step.
Can UVID be prevented?
It can be reduced on both sides. At cell level: AlOx thickness and deposition method, a SiON cap, PEALD instead of conventional PECVD, the SiNx refractive index, and hydrogen management across deposition and firing. At module level: encapsulant films that cut off or down-shift ultraviolet before it reaches the cells. Neither replaces a stabilized measurement, which is what makes the remaining loss visible in the first place.
Final Thoughts
TOPCon UVID has moved in two years from something quietly ignored to something that appears in qualification discussions, and the pendulum has swung in both directions. A report without a recovery step can attach a durability problem to a product that does not have one. A vague claim that the loss is recoverable can equally bury a permanent one.
The r-UVID and ir-UVID split, together with the recovery procedure in IEC TS 63624-1, makes the question measurable, interpretable and eventually priceable. For anyone working on the line, the practical takeaway is a single habit: when a ultraviolet test report arrives, check whether a recovery step was run, and look at what is left afterwards. The rest of the number is a temporary state.
Related reading:
- UVID in TOPCon cells: tracking passivation degradation with non-contact IV testing
- Photovoltaic module UV light-conversion film: functions and key quality parameters
- TOPCon front-film SiNx: what the refractive index does to module power
- PV module reliability tests: the full list, and which failures each one catches
- DH1000 damp heat test: failure modes and mechanisms
- IEC TS 62915: what a module change forces you to retest
- How PV standards relate: IEC, UL, GB/T, industry and group standards
- EL testing for solar panels: inline versus offline setup
Mechanisms and figures are drawn from the 2026 classification published in Solar Energy Materials and Solar Cells, the draft and project documentation for IEC TS 63624-1, published outdoor correlation work, and the UV test procedures currently offered by independent module test programmes. Dose values described as draft remain subject to change until the Technical Specification is published. No customer or production data is reported here.