The Bottleneck in Fine-Line Screen Printing
Table of Contents
Quick answer: Fine-line screen printing exists in a permanent state of catching up with its own specification: the paper describing what the process can do is out of date before it is published, because the finger widths in production keep shrinking. The reason is arithmetic. A narrower finger blocks less light and raises the current the cell produces, but it also has a higher resistance and a smaller contact area, so the paste formulation, the screen mesh and the printing parameters all have to advance together. The dimensions in play run from around 13 µm down through 9 µm to 6 µm, with achievable widths reported in the 16 µm to 24 µm band depending on the structure. Each reduction is a small gain that only materialises if yield holds, which is why fine-line printing is a yield problem as much as a design one.
PV Module Manufacturing · by Jerry, Ooitech
A paper has just been accepted, but the data is already out of date. Anyone working in R&D knows this awkward situation.
Fraunhofer ISE's paper, "Progress in Fine-Line Front-Side Printing for TOPCon Solar Cells," is a typical example. Its most aggressive design used a knotless screen with a 13 µm opening. Anything finer became unstable in the experiments. According to publicly available industry information, leading cell manufacturers had already pushed knotless screen openings to 6 µm by 2026—less than half the size reported in the paper.
That apparent obsolescence is exactly why the paper is worth reading. It mapped the practical capability boundary of screen printing in 2024–2025. The manufacturers that later moved beyond this boundary were still working with the same trade-off framework described in the study.
Numbers expire. Methods do not. This article looks at two things: what the paper identified at the time, and how mass production later pushed past that supposed limit.
1. What Happened in the Paper
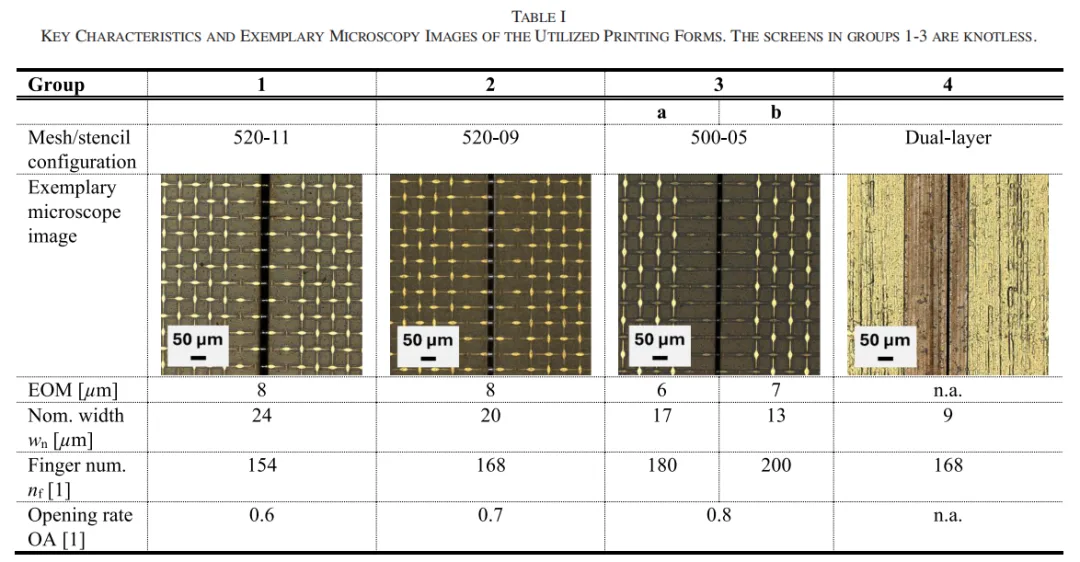
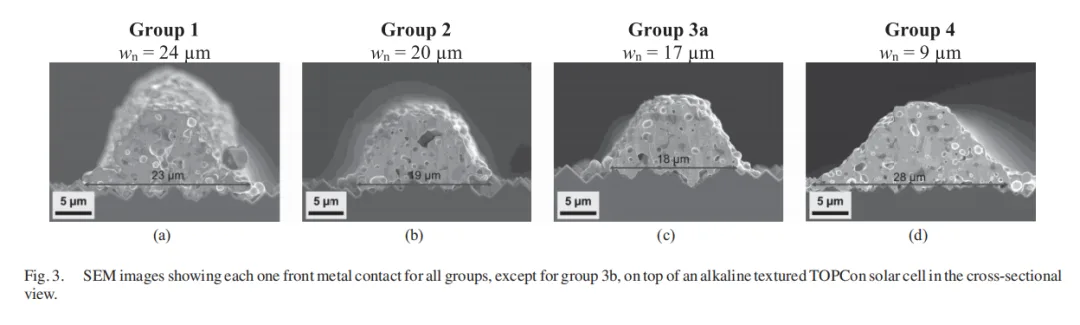
The experimental design was straightforward. The researchers used M10-format n-type TOPCon solar cells and divided the front-side printing process into several single-variable comparison groups. These included three knotless screens with nominal openings of 24, 20, 17 and 13 µm, plus a 9 µm double-layer metal foil stencil. The rear-side process remained unchanged. Only the front-side printing method was varied.
The study also used a complete characterization chain:
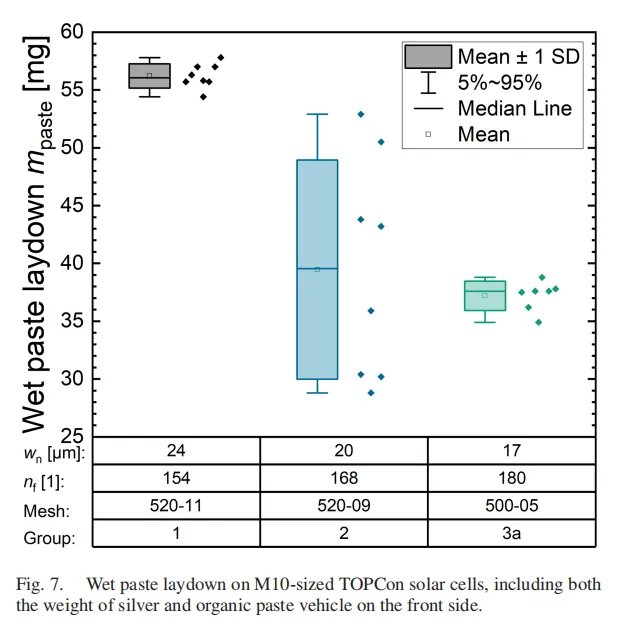
Wet paste weighing to calculate silver consumption
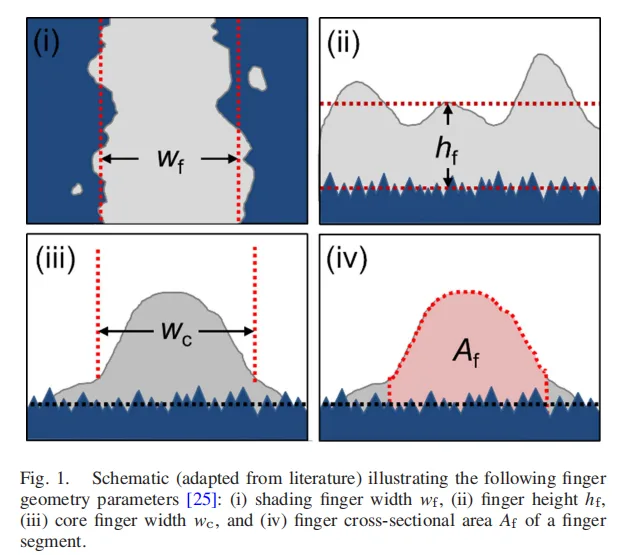
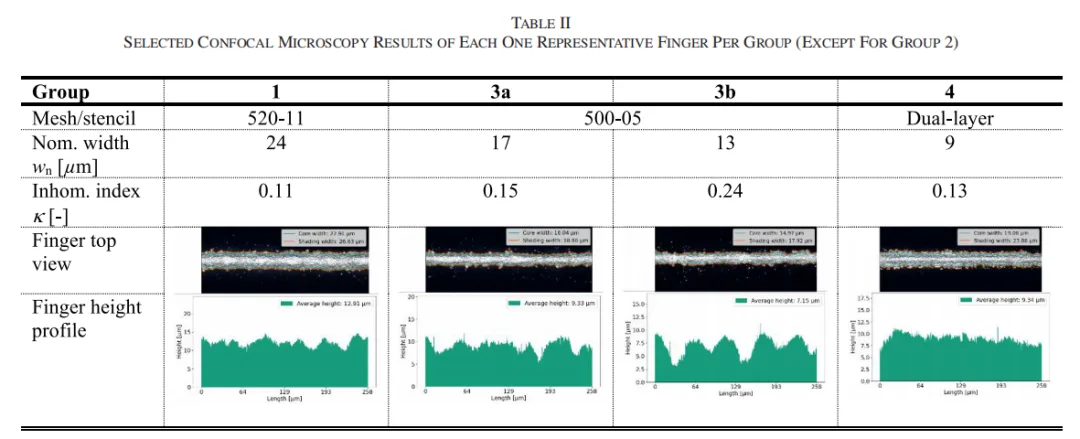
Scanning electron microscopy and confocal microscopy to measure finger width, height, cross-sectional area and non-uniformity κ
Transfer length method measurements for contact resistance
I-V testing on completed M10 solar cells
This sequence remains a standard way to evaluate a new screen, stencil or metallization paste.
The results can be divided into three levels:
The 17 µm opening was the best operating range. It produced a printed finger width of 16 µm. Compared with the 24 µm reference group, it delivered a 0.9% relative efficiency gain and reduced front-side paste consumption by 30%.
The 13 µm opening hit a wall. Finger non-uniformity κ jumped from 0.15 to 0.24, while interrupted fingers and other defects increased. This group did not proceed to cell-level evaluation.
The 9 µm stencil became a negative example. A screen-printing paste was forced onto the stencil despite a viscosity mismatch. The resulting printed finger was 19 µm wide—wider than the finger produced by the 13 µm screen-opening group.
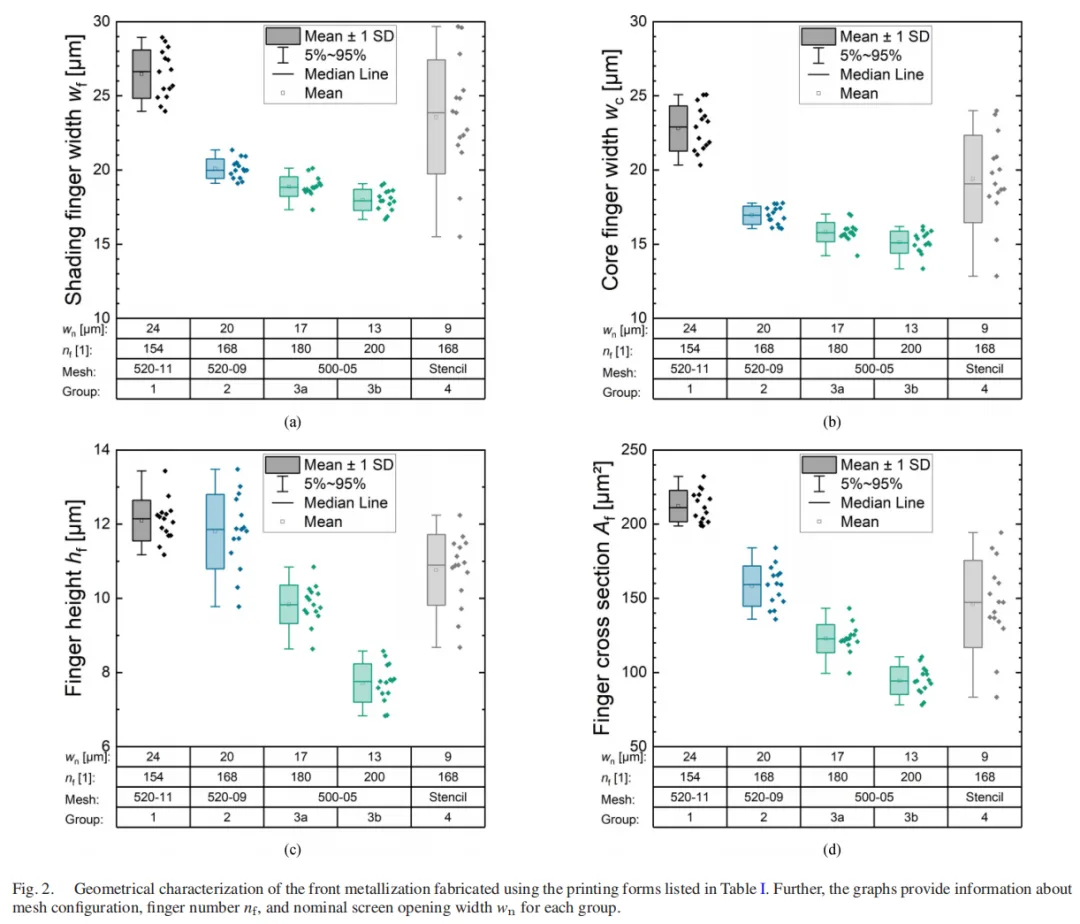
The implication was clear. For knotless screen printing, the practical fine-line range was around a 15–17 µm opening. Below that point, printing quality broke down first.
The time gap between the paper and 2026 production: four comparisons
1. The printing limit
In the paper, a 13 µm opening was already unstable. Non-uniformity κ rose to 0.24, defects increased and the group never reached cell evaluation. According to publicly available industry information, leading production lines had moved to 6 µm knotless screen openings by 2026.
The capability boundary drawn by the paper had been pushed much further forward. The so-called limit was not a permanent wall. It was the balance point between the paste, screen and printing equipment available at the time.
2. The motivation to save paste
The best group in the paper—a 17 µm opening and 16 µm printed finger—achieved a 0.9% relative efficiency improvement while reducing front-side paste consumption by 30%.
By 2026, silver consumption had become the largest non-silicon cost item in many cell production cost structures. Paste saving was no longer a secondary optimization target. It had become a matter of production competitiveness and, in some cases, survival. The paper's methodology had shifted from an efficiency tool to a cost-control tool.
3. The stencil route
The paper's 9 µm metal foil stencil failed because the paste viscosity did not match the printing method. It produced a 19 µm-wide finger.
By 2026, steel plate printing based on a full-opening metal stencil had entered mass production. A failed route in the paper later became an important industrial direction. The lesson is direct: changing the printing method also requires changing the paste.
4. The value of the efficiency gain
The paper reported a 0.9% relative efficiency gain. By 2026, cell efficiencies had entered the 26%+ range, with reported results between 26.09% and 26.66% in the examples discussed here.
The marginal value of reducing shading still existed, but the main commercial driver had moved from efficiency improvement toward silver reduction.
2. From 13 µm to 6 µm: How the Limit Was Broken
Was 13 µm really the physical limit of screen printing?
No. The paper itself left several clues.
Across the three screen designs, wire diameter decreased from 11 µm to 9 µm and then to 5 µm. The open-area ratio increased from 0.6 to 0.7 and then 0.8. A 0° mesh orientation was also introduced.
In other words, the 13 µm result did not mean that screens could not be made any finer. It meant that the paste, screen and equipment combination available at the time could not remain stable at that point.
Which side of this triangle was the real bottleneck?
The screen itself can be partly ruled out. The study represented advanced knotless screen technology for its time. Wire diameter, open-area ratio and screen angle had already been pushed hard. The 13 µm group did not fail because the screen supplier had made no effort. The screen was being held back by the paste.
The printing equipment was also based on a general industrial platform. Similar printers were available in both laboratories and leading production lines. That leaves the paste as the key variable.
Fine-line printing is a three-way tug-of-war. Every 1 µm reduction in finger width lowers optical shading, but it also reduces the finger cross-sectional area. Series resistance can rise, while the risk of printing defects and yield loss increases. The result depends on whether the paste, screen and process can move forward together.
Between 2024 and 2026, all three sides advanced.
Paste: from a general-purpose compound to a patterning material
Silver particle sizes continued to decrease, while dedicated fine-line pastes became a separate product category. TOPCon front-side fine-finger paste development moved in three directions: printing narrower fingers, maintaining good firing behavior and avoiding an increase in electrical resistance.
With a 6 µm screen opening, particles that are only slightly too large may clog the screen. Maintaining a consistent finger profile becomes even harder.
Fine-finger non-uniformity κ is, at its core, a reflection of paste rheology under extremely narrow openings. If the paste cannot transfer consistently through a 6 µm opening, the result is screen clogging, interrupted fingers and a sharp increase in κ. The 13 µm group in the paper appeared to fail because of printing quality. At a deeper level, the paste had reached its transfer limit under that opening.
The close relationship between paste formulation and printing method has been demonstrated repeatedly over the past two years.
Screen: knotless structures and 0° orientation became standard
The paper's 500-05 screen—with a 5 µm wire diameter, 0.8 open-area ratio and 0° orientation—was already an aggressive design at the time.
Leading production screens later moved another generation in the same direction. Wire diameters became finer, open-area ratios increased and tension control improved. Stable production with a 6 µm opening first requires extremely high manufacturing precision in the screen itself.
Process: LECO controlled fine-finger contact resistance
This is the side that is often overlooked.
As fingers become narrower, the contact area decreases. Contact resistance would normally rise sharply. LECO, or laser-enhanced contact optimization, has become widely associated with fine-line TOPCon production because it can reduce this electrical loss.
Industry reports indicate that LECO has already been adopted across a large share of TOPCon capacity. It has moved from an optional efficiency enhancement to a practical enabling process for fine-finger production. Without LECO or an equivalent contact-optimization approach, successfully printing through a 6 µm opening does not necessarily mean the process is ready for stable mass production.
Once the paste, screen and process all moved forward, the balance point shifted from around 15 µm toward the 6–8 µm range. The limit was not broken by one dramatic invention. Three forces pushed it at the same time.
3. The Methodology Left by the Paper
If there is only one thing to take away from this paper, it should be the framework rather than the numbers.
First: the three-way trade-off
Every fine-line printing solution is a balance between optical shading, electrical resistance and printing quality. This framework remains valid even as feature sizes become smaller. The same logic can be used to evaluate steel plate printing, electroformed screens and other metallization routes.
Second: the characterization chain
Weigh the paste, inspect the geometry, measure contact resistance and then test the completed cell. Once these four steps are complete, the value of a new screen or paste can be quantified.
Why did the 13 µm group not proceed to cell evaluation? Because geometric characterization had already revealed the problem through the sharp rise in κ. The sequence—inspect morphology first, measure electrical performance second and evaluate the cell last—helps prevent one efficiency number from hiding a weak or unstable process.
Third: the paste and printing method must change together
The 9 µm stencil failed because a screen-printing paste was forced onto a stencil process. Factories introducing steel plate printing now commonly adjust or redevelop their paste formulations. The paper had already marked this trap through one unsuccessful experimental group.
Fourth: finger count should be calculated, not guessed
The paper used pre-measured resistance data to calculate the optimum number of fine fingers, following the kind of logic used by tools such as Gridmaster and Pitchmaster.
Moving from experience-based grid design to calculated grid design is increasingly valuable in the fine-line era. Narrowing the fingers without recalculating pitch, finger count and resistance can simply move losses from shading to series resistance.
4. The New Battleground the Paper Did Not Cover
The paper stopped at screen printing and metal foil stencils. By 2026, however, the fine-line battleground was no longer limited to conventional screen printing. Screen tension and structural limits make stable mass production below 10 µm increasingly difficult, so the industry has been exploring several alternatives.
Steel plate printing: A full-opening metal stencil can produce 14–15 µm fingers. In the example discussed here, the aspect ratio increased from 45% to 59%, while contact resistance fell by 15%. Research published in Joule by the Ningbo Institute of Materials Technology and Engineering reported progress in this direction, and Tongwei was reported as the first company to introduce the process into global mass production. In practical terms, steel plate printing turned the paper's failed stencil concept into a production route by solving the paste-matching problem.
Electroformed screens: According to industry reports and manufacturer claims, finger-pattern accuracy can reach ±2 µm. TOPCon cells using electroformed screens have been reported at 26.2% efficiency. These figures should still be assessed against production yield, measurement conditions and long-term process stability.
R&D lines reached 10 µm fingers: Joint work by the Ningbo Institute of Materials Technology and Engineering and JinkoSolar reduced finger width to 10 µm and pitch from 1,120 µm to 825 µm. The industrial M10 cell achieved a certified efficiency of 26.66% in the reported result.
The paper also did not focus on the absolute value of silver consumption. Fine-line printing delivered a relative paste reduction of 30%, but by 2026 the main conflict was the absolute consumption per cell.
For 210R cells, the industry average silver paste consumption had entered the 70+ mg per cell range according to the industry figures discussed here. Silver had become the largest non-silicon cost item. Paste reduction shifted from an optimization target to a production priority.
Fine-line printing is only one approach. Silver-coated copper paste, copper electroplating and other silver-reduction or silver-free metallization routes are advancing at the same time.
5. How Production-Line Engineers Should Read This Paper
Three practical actions matter.
First: focus on the framework, not the old numbers
The production records have already moved beyond the paper's numerical limits. Its three-way trade-off, characterization chain and paste-process coupling logic are still useful. They provide a working template for evaluating any new screen, paste or metallization process on an actual production line.
Second: calculate your own balance point
The fact that a leading manufacturer can run a 6 µm opening does not mean every line should immediately adopt it.
Your paste system, screen supplier, printer condition, LECO configuration, furnace window and baseline yield determine where your real balance point sits. Following the smallest available opening without validating these factors may reproduce the paper's 13 µm failure: rising κ, interrupted fingers and a sudden increase in defects.
Third: break silver reduction into engineering problems
Silver is a major non-silicon cost item. Fine-line printing, paste optimization, screen development, silver-coated copper and copper plating each have their own balance between efficiency, resistance, process stability, equipment investment and yield.
The paper does not provide one final answer. It provides a tool for breaking the problem into measurable parts.
Summary
A 13 µm opening was once treated as the limit of knotless screen printing. According to publicly available industry information, that boundary had been pushed toward 6 µm by 2026.
The limit was never a wall. It was the intersection of material capability, equipment accuracy and process control at a particular time. Paste was one of the most underestimated parts of that intersection. It caused the failed groups in the paper, and it later became one of the deciding factors in mass production.
The intersection will keep moving. The framework will not. That is the lasting value of this paper.
Poll: What front-side fine-finger level has your production line reached?
Which silver-reduction route are you currently using: finer fingers, silver-coated copper or copper electroplating?
#TOPCon #ScreenPrinting #FineLinePrinting #SilverPaste #LECO #SteelPlatePrinting
Ooitech's View
The real production target is not the smallest screen opening; it is the lowest silver consumption that can be maintained without sacrificing contact resistance, yield or uptime. A 6 µm process only creates value when the paste rheology, screen tension, printing parameters, firing window and LECO settings are qualified as one system. For line engineers, κ, interruption rate and resistance distribution are usually more useful than a single best-cell efficiency result.